Launched: oBudget.org

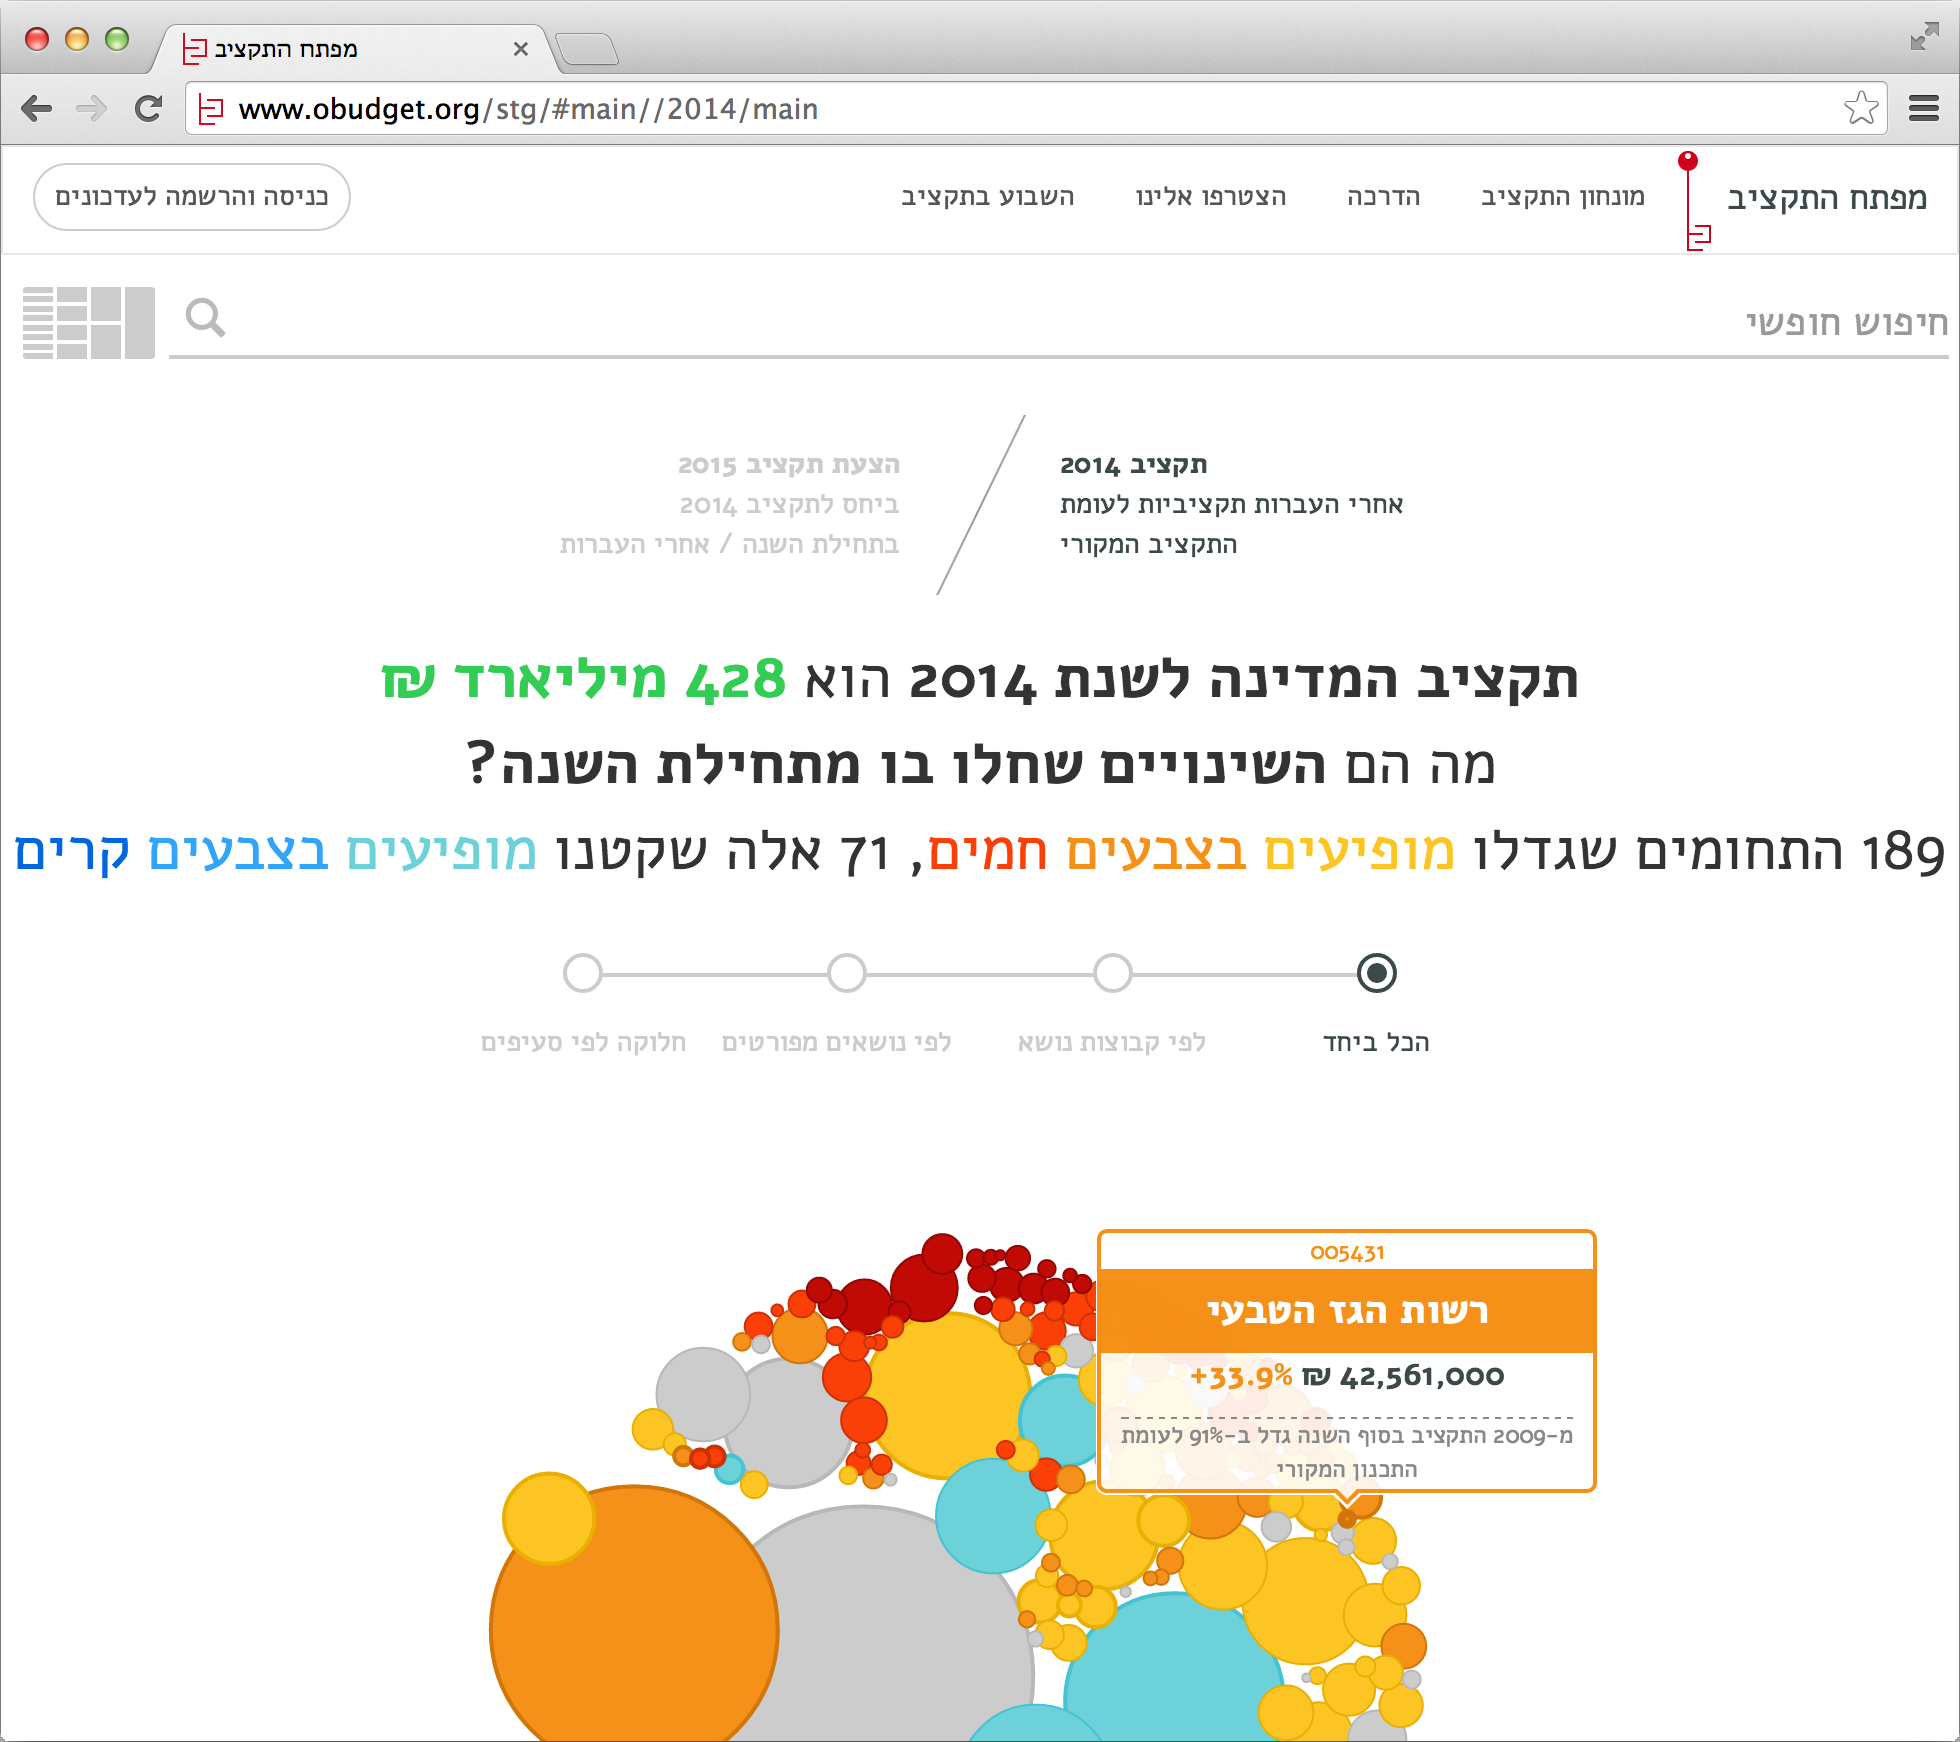
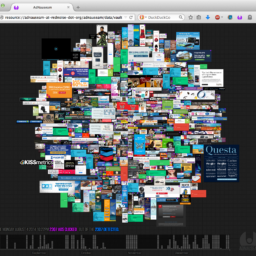
We’ve just launched oBudget.org — The Budget Key (מפתח התקציב) an Israeli budget transparency site exposing, comparing and visualizing the way the budget changes and extending civil society’s ability to follow the money. This is one of the Public Knowledge Workshop’s main initiatives. It was led by Adam Kariv (who developed it) and by myself … Continue reading Launched: oBudget.org

Slides for my “Conflict of Interface” talk at Eyebeam

Conflict of Interface (eng) from Mushon Zer-Aviv Originally presented at The Politics of Interface and Obfuscation a special event at Eyebeam, NYC on March 11th, 2014, together with Helen Nissenbaum (NYU) and moderated by Michael Connor (Rhizome). The internet, once associated with openness and decentralization, is increasingly understood in terms of control exerted by government … Continue reading Slides for my “Conflict of Interface” talk at Eyebeam

Disinformation Visualization: How to lie with datavis (the essay)

Following my Disinformation Visualization workshop at the Info Activism Camp, the wonderful people at the Tactical Tech Collective have invited me to publish these ideas as an essay on their site. I am cross-posting the opening here and encourage you to read the whole thing on the Visualizing Advocacy site (and get their wonderful book … Continue reading Disinformation Visualization: How to lie with datavis (the essay)

OPEN DESIGN NOW / Learning By Doing

open-design-now-why-design-cannot-remain-exclusive

I guess “NOW” is relative as the essay I wrote for Open Design Now is now at least 2 years old. But still I figured it makes sense to share. (on more than one level) I recommend reading this in the original site, but just as a backup I will publish it here as well. One of the reasons I waited with publishing it here in the blog (even though the whole book is CC-SA-BY licensed) is that the publishing model they took was to slowly publish the essays over a long period of time, one essay at a time. And the book was going from 0% open to 100% open. It’s an interesting model, certainly a compromise between the OPENESS tribe and the publisher’s concern over the INTELLECTUAL PROPERTY and the commodification of the content. Now that it is 100% open, and my essay is just slightly dated, I think it’s fair to share it here :)

Mushon Zer-Aviv describes his efforts to teach open source design as an attempt to investigate why collaborative work combined with individual autonomy has not been common practice in design, as it is in open source software development. He discusses whether what worked for code might just as easily be transferred to design: the physical object as binary structure.

Continue reading “OPEN DESIGN NOW / Learning By Doing”

The Turing Normalizing Machine

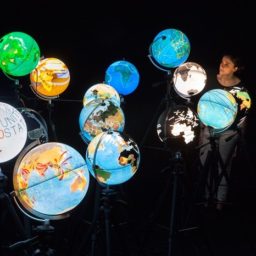
A machine learning experiment trying to decode social normalcy. This is a collaboration between Yonatan Ben-Simhon and myself and was initially presented at the Science Museum in Jerusalem as a part of the Other Lives exhibition inspired by the life and work of Alan Turing on his birthday anniversary. More at the project’s page: mushon.com/tnm Continue reading The Turing Normalizing Machine

RE: Open Knowledge Festival—Between Open Data and Public Knowledge

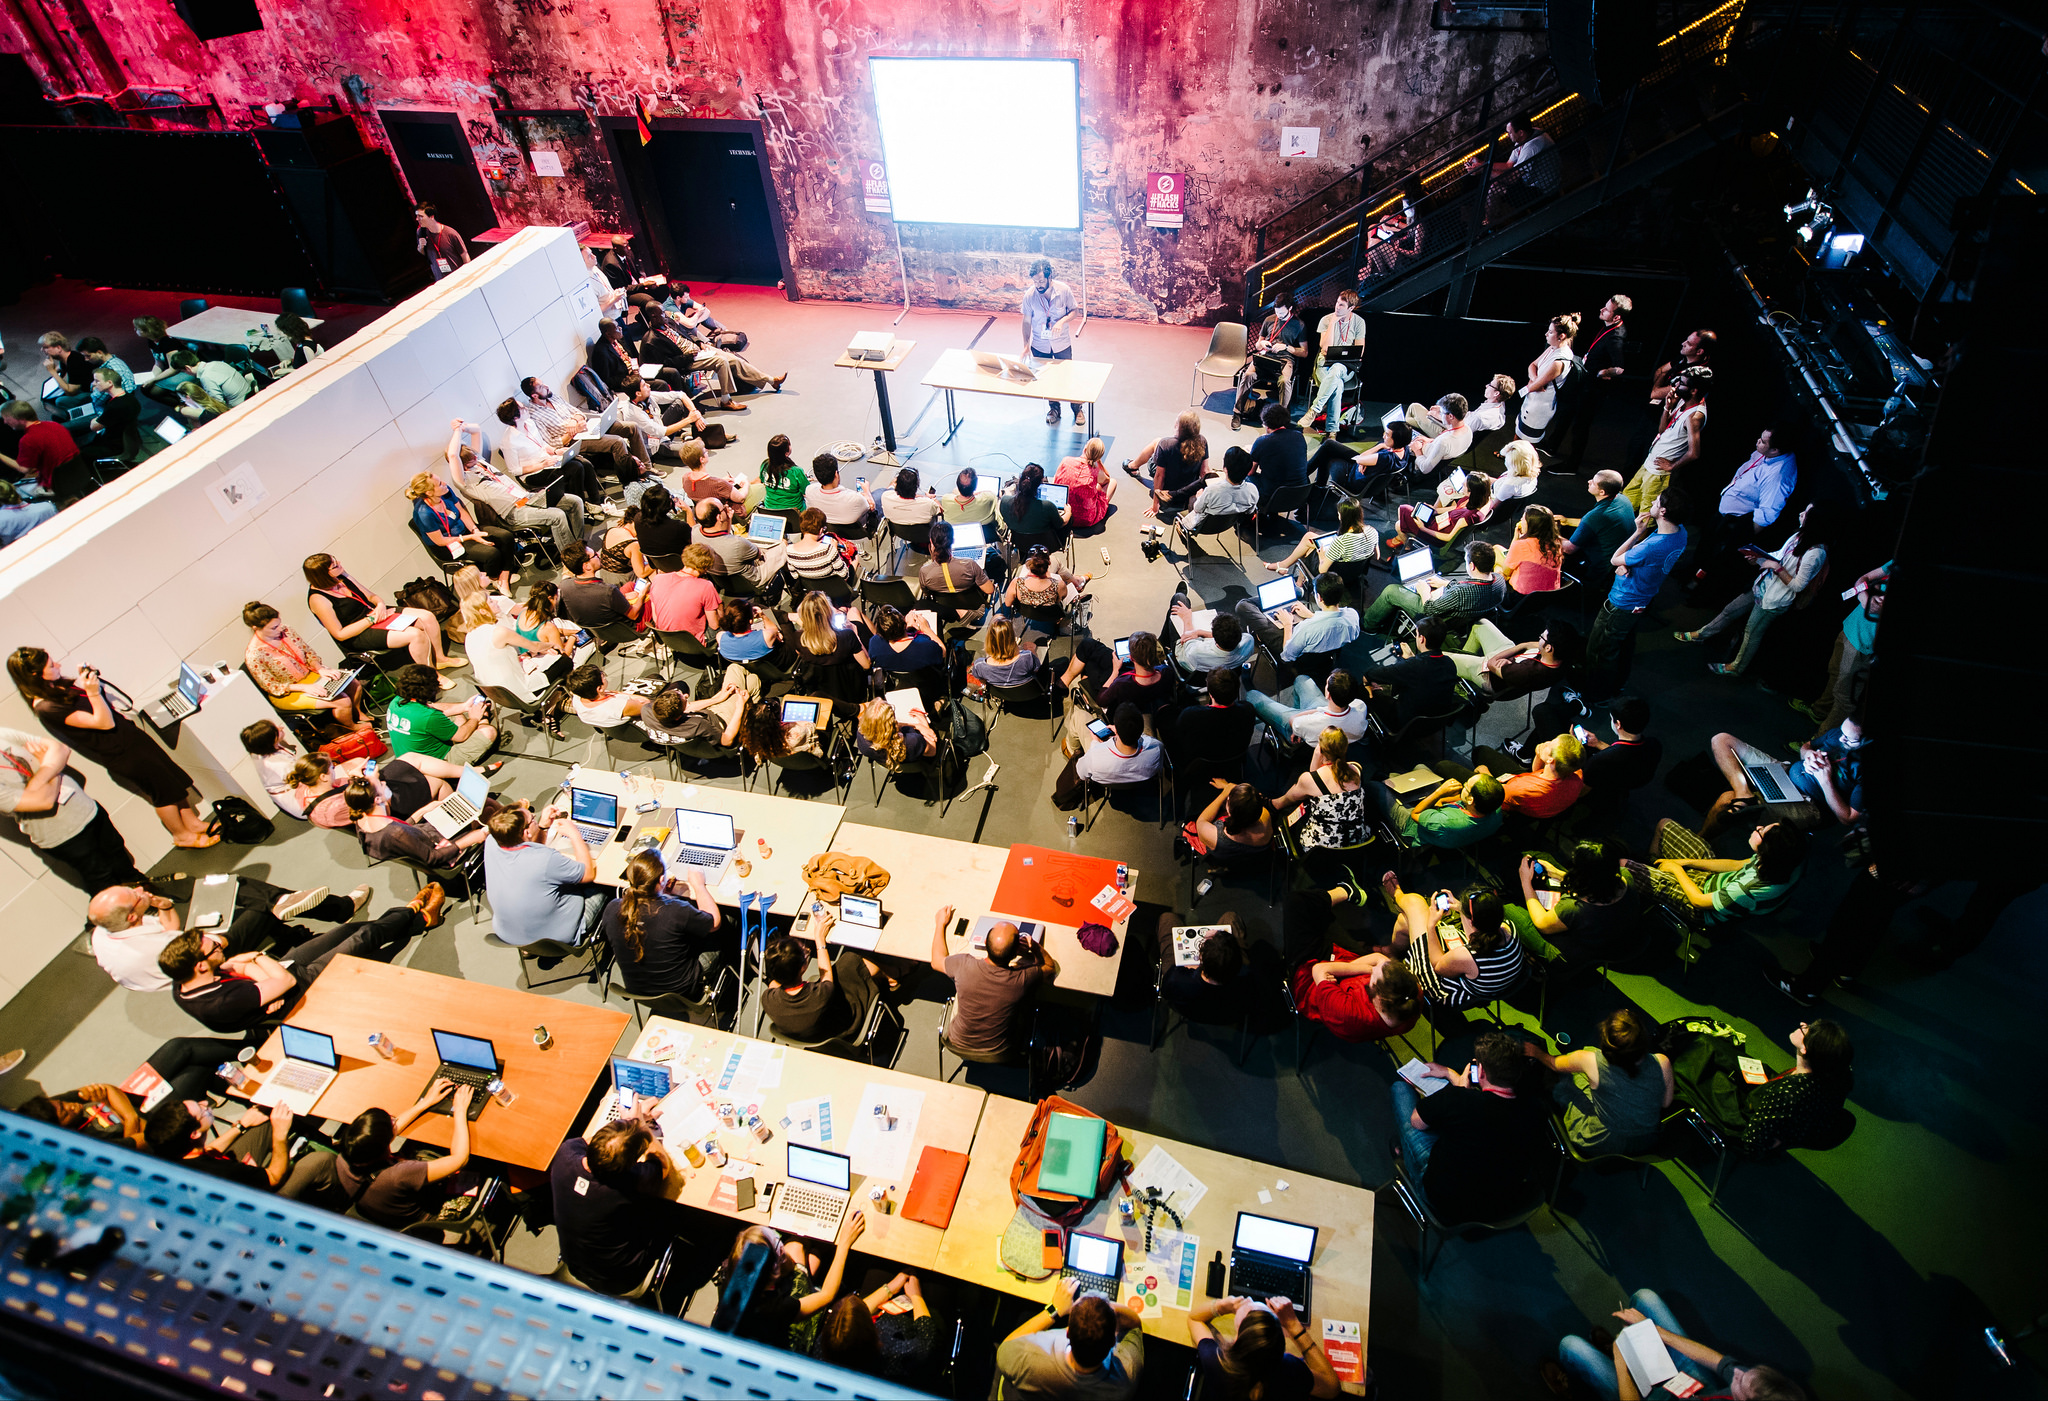
The first Open Knowledge Festival (#OKfest) took place in Helsinki, Finland, September 17-22, 2012. The festival, arranged by the UK based Open Knowledge Foundation was dedicated to the growing culture of openness extended through digital technology. Following that spirit it covered 13 different “topic streams” coordinated by multiple program planners and attracting talks, panels, workshops … Continue reading RE: Open Knowledge Festival—Between Open Data and Public Knowledge

Dis-Information-Visualization Workshop Summary / Helsinki Sep 2012

The 1st Open Knowledge Festival was also the host of the 1st Dis-Information-Visualization workshop, a critical attempt to actively explore the dark side of information visualization. In the full day workshop (led by me, Mushon Zer-Aviv, and organized by Pixelache and the Mushrooming Network) 4 groups were encouraged to lie with infographics. Rather than falsifying the data, the dis-info-visualizers have manipulated its meaning by creating truthful, yet misleading representations.

We started with an introductory presentation offering a few critical tools through which to investigate (and generate) visual manipulation. The talk suggested that rather than looking at data information visualization as “Beautiful Evidence” (to quote the title of a book by Edward Tufte) we should read them as often beautiful and sometimes even seductive arguments.

Continue reading “Dis-Information-Visualization Workshop Summary / Helsinki Sep 2012”